Let’s start this expiry outlook with analysis of: Monthly, Weekly, Daily, Hourly time-frames.
Monthly time-frame
Past Analysis
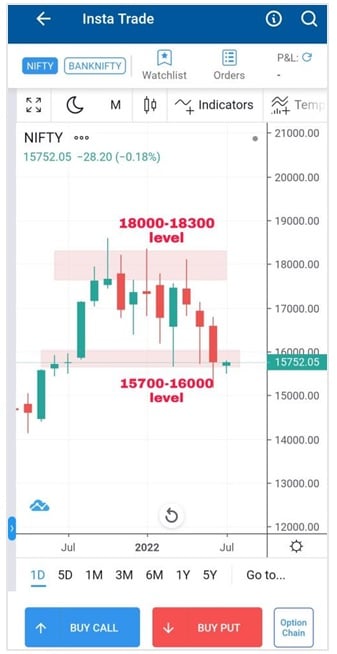
- Major resistance zone 18000-18300, got rejected several times from this zone.
- Nifty found support at 15700-16000zone twice in March & May Month.
- June month candle has broken the major support zone of 15700, but recovered from the lows of 15200.
Now what
- Monthly time-frame indicates a bearish hold in the market, however there is support from 15200 levels, 16800 being major resistance.
Weekly Time-frame
Past Analysis
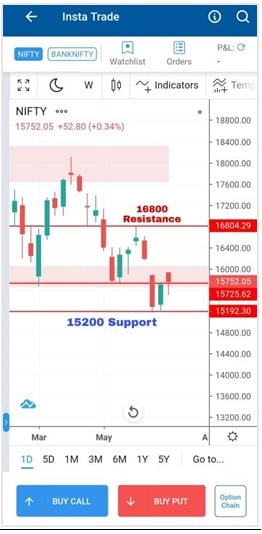
- Nifty was falling in Lower High – Lower Low pattern since past months.
- Latest fall from 18100 levels up-to the support zone of 15700-16000.
- Bounced back from support zone of 15700 to 16800level, from where it resumed down-trend with hammer pattern formation at 16800.
- After getting resitance from 16800, In last two week bears gripped the market with full power, broken the major support zone (15700-16000). However, in last week, Nifty got supported from 15200 level closing in green.
Now what
- Last week candle indicates indecisiveness in market, last week has been very volatile, gave no cues about future direction. For this week, 15900will act as major resistance zone &15500-15700 being major support.
Daily Time-frame Analysis
Past Analysis
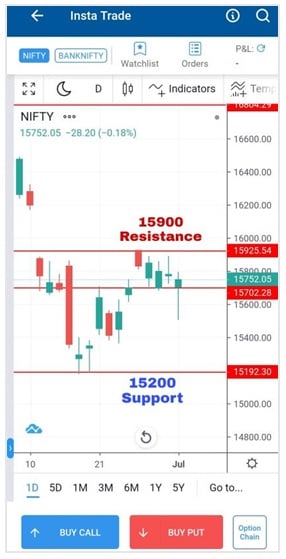
- From the resistance level of 16800, it keeps falling, however to spent some time at important level of
- On 16June, Nifty fell with a big red candle from the level of 15700 to 15300 levels (400pts) in single day.
- However, from 15200 level it bulls gathered their power to take market again up to 15700 level where market is trading with volatility in complete last week.
Now what
- Last week, bulls has broken 15700 level, but still there is no followup move upside, Nifty has been trading in tight range of 15700 – 15900 in past week.
Hourly Time-frame Analysis
Past Analysis
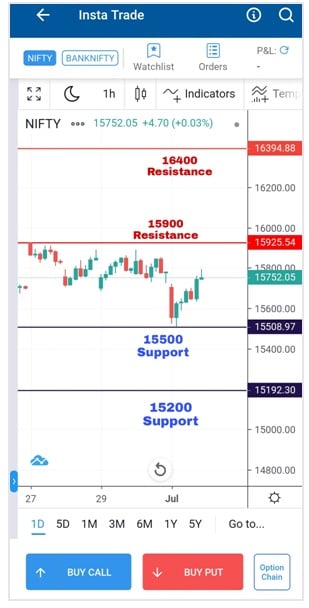
- In past 5 days market been trading in tight range of 15700-15900 zone.
Now What
- On Friday, bears broken 15700 level but bulls pulled it again back to 15700 from the lows of 15500.
Concluding Analysis :
- At 15200 But tried to fight and took Nifty to 15700 level.
- 15700 acted as resistance for Bulls. However from 15200 Nifty was moving up with lower high lower low form and formed W pattern from the level of 15400.
- 15700 has been broken by bulls, now 15700 will act as good support zone. But upward rally can only begin once bulls breaks 15900 zone.
- If again bears tries to bring market below 15700 then 15200 level can be retested again.
So important levels to watch:
Support & Resistance Zone
| Range |
Support |
Resistance |
| Narrow Range |
15500 |
16000 |
| Broader Range |
15200 |
16400 |
Try Insta Trade
The easiest Options Trading platform! Get Charts, Watchlist, Positions & live P&L in single screen
Trade Now


