Charts are an important screen where a trader makes crucial trading decisions frequently. They offer a large set of real-time data which the trader needs to keep track of constantly. This is true especially for high-frequency traders who may create and exit positions in a matter of minutes. Therefore it is best if you have to spend less time on other screens and instead, be able to access and track key data on the chart itself.
With this principle in mind, we are increasing the number of data points that you can view and functions that you can perform on the chart itself. So now you can cover the journey of creating and exiting a position without having to leave the chart view!
Note: These features must be activated by you before you can start viewing them. The steps to activate them have been stated in the following sections.
Let us now see in detail how to view or modify your open orders and positions from the chart on the web app.
If an order has been placed but has not been executed yet, then it comes under the category of ‘Open Orders’. Suppose you have placed an intraday stop loss order on a scrip that you own at ₹439.50.
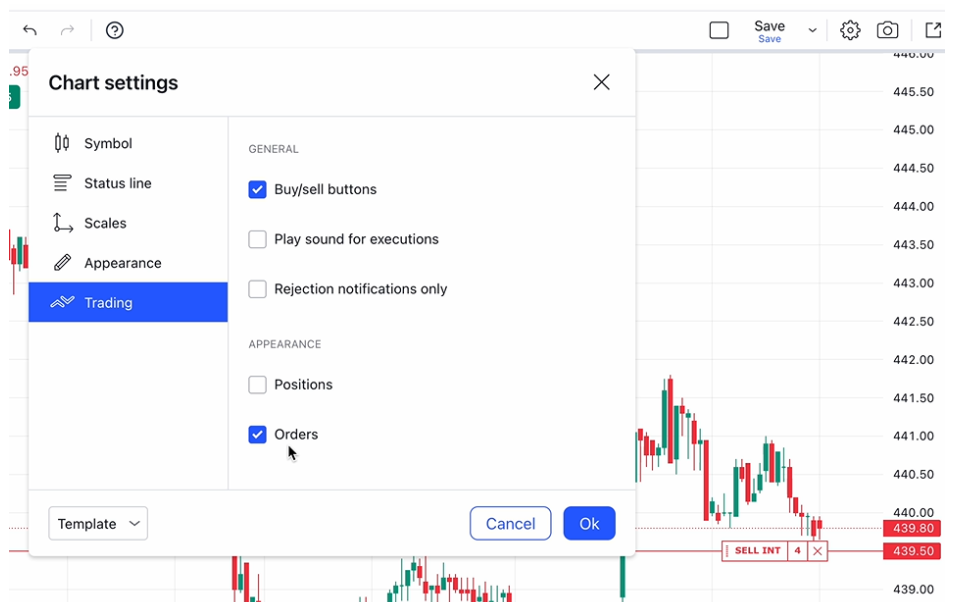
Now to view the order on the chart, you will have to turn on the feature by taking the following steps:
You will now be able to view the stop loss order on the chart itself. Each order will have the following details showing on the chart:
Next to the order information, there will be a line denoting the price level at which the order exists.

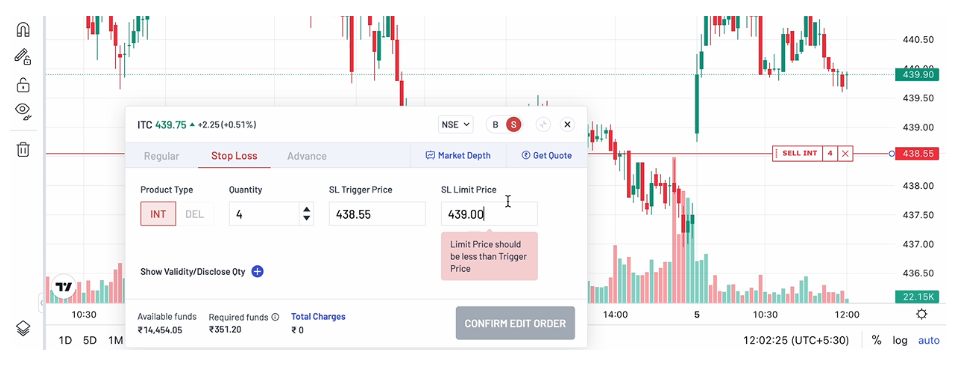
You can also modify an open order directly from this chart. To do so:

Once one or more orders for a particular asset are executed, the details of the resulting gains or losses from that asset are reflected in the ‘Positions’ section. Like the open orders, to activate positions on your chart, you will have to go to Settings>Trading>Check the box next to Positions.
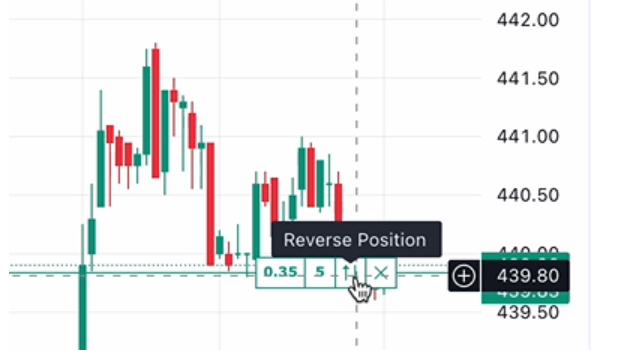
Activating positions on your chart will show you the following information related to each of the positions that you have on that scrip:
You can also modify the position by taking the following steps:

So far, you could access the list of open orders and positions across assets only under the ‘ORDERS’ section of Angel One. However, the framework was not optimised to view a large number of open orders and positions, especially scripwise orders/positions relative to the current market price of the scrip.
But now you can view all the open orders and positions you have on a scrip in one place, mapped onto the chart of the scrip. This new view will help you understand your overall trading strategy related to a particular scrip (such as a Nifty 50 derivative) more holistically. The hedges that you create via multiple option contracts will now be visible to you in a comprehensive diagram form.
Moreover, you can place an order, track its status, track its profit or loss, and then exit it right from the chart itself.
To reduce the clutter, you can also choose to view only the orders or only the positions of that scrip by choosing either one on the Trading section under Settings on the chart.
Angel One offers a range of new features that take your trading game to a whole new level. If you are new to trading in the stock market, open demat account with Angel One today! If you want to know more about the product, join the Angel One Community page where we discuss product features and raise queries regarding the same.
Published on: Oct 3, 2023, 6:36 PM IST
We're Live on WhatsApp! Join our channel for market insights & updates