
In our previous Blog (Blog 8 – Indian Banking Sector Update – Part 1) we had stated that the next Blog would contain what to expect from the Banking Sector in FY22 and top banks based on market capitalization. Before we get into the details we must first focus on the few other data points that showcase the scenario of Indian banks at current level. We would start with the provision coverage ratio of the banks.
In simple terms the provision coverage ratio means the amount banks have already provided for non-performing assets (NPAs). In the previous blog we had provided the figures of Gross Non-performing assets (GNPAs). The calculation of provision coverage ratio is
= Total Provisions / Gross NPAs.
When we reduce the provisions from Gross NPA we get Net NPAs.
The following chart clearly shows how the different banks have provided for FY21. Usually the higher provisioning indicates that the management is conservative in terms of recovery and hence providing for it. Higher provision impacts the bottomline and hence not many would feel it as a good idea. However in the long run the practice usually plays in favour.
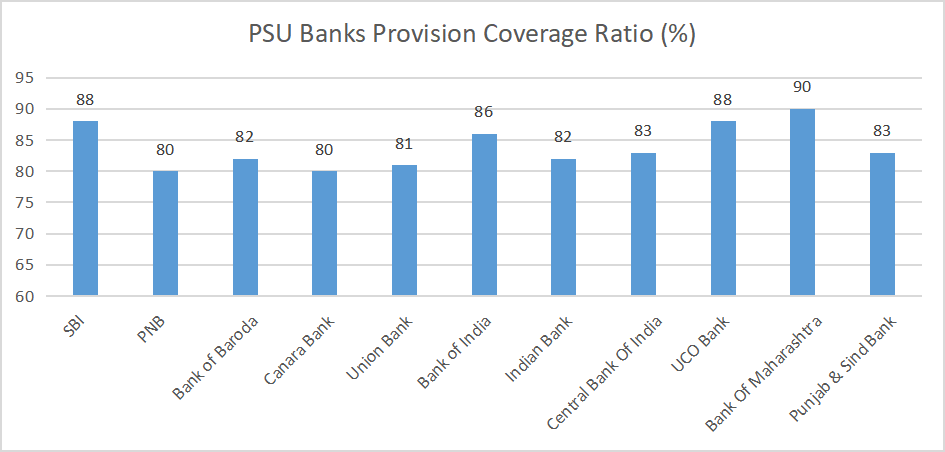
In the above chart it is visible that the Public Sector Undertaking (PSU) banks are provided for more than 80 percent of the GNPAs. After the Covid-19 impact most of the PSU banks have created the provisioning buffer.
In case of private banks as well the provisioning has been on the higher side. Players like IDBI Bank (having highest GNPAs) have already provided for the 97 percent. It is followed by Axis Bank with 88 percent and Kotak Mahindra Bank 84 percent. The lowest provision in Private Banks is IDFC First with just 56 percent. We opine IDFC First may be facing a larger risk with lowest provisioning. Further the merger with Capital First has increased exposure to the unsecured portfolio. Apart from this the banks like RBL Bank and IndusInd Bank have already witnessed pressure on account of poor quality loan book. Rather IndusInd Bank scrip declined significantly on the bourses due to similar reasons. There is some amount of stability visible now. However, it is better to be cautious than being sorry.
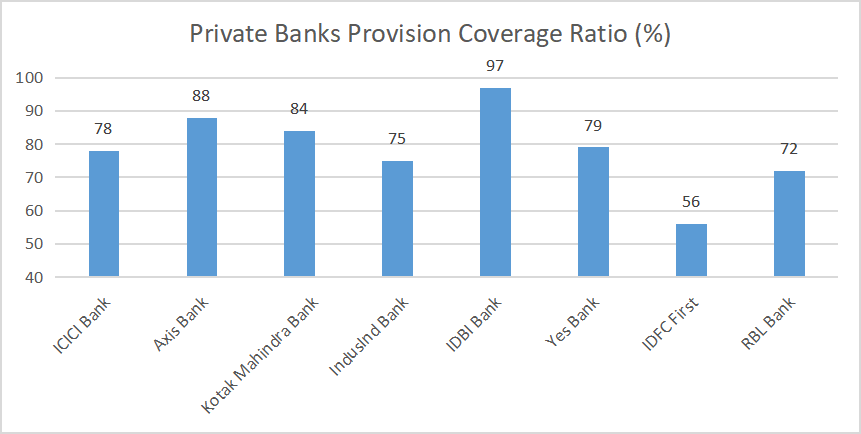
In case of other private sector banks, CSB Bank has provided for the highest amount and lowest is South Indian Bank.
While we have already spoken about the GNPAs and the provisioning, it is time to discuss the future growth prospects for the sector. We believe most of the banks are shifting focus towards wholesale lending. Considering the factor, we have provided the charts for market share enjoyed by different banks in the wholesale segment. Let’s first have a look at the broader segment.
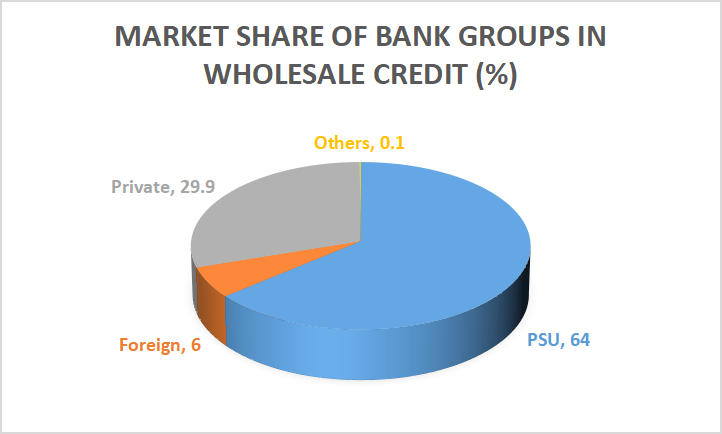
The above chart clearly shows how the PSU Banks are dominating this space. With 64 percent market Share the PSU Banks have an advantage over the private players and even the foreign banks.
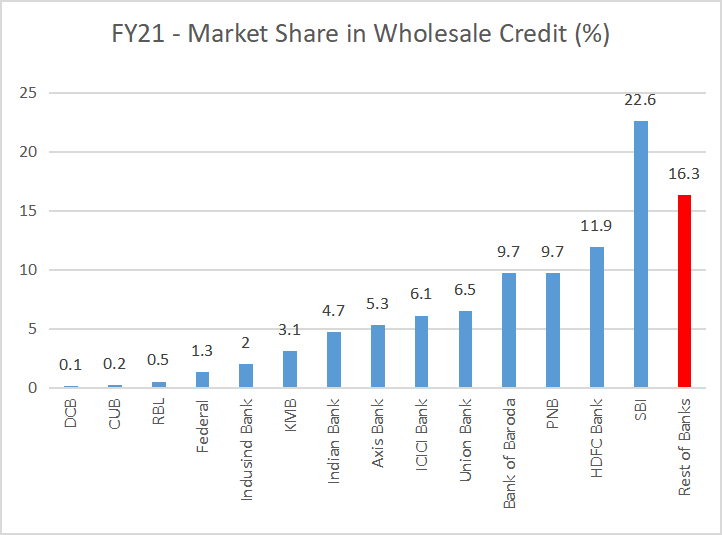
This leads us to an important factor about which bank owns the largest market share on an individual basis. Here the SBI makes it to the top with 22.6 percent market share in the Wholesale Credit segment. In the private Segment HDFC Banks has been Focusing on the wholesale Credit and Stands at the second position with 11.9 percent share. In the private sector ICICI Bank and Axis Bank are way behind HDFC Bank and even the PSU Banks like PNB and even Bank of Baroda.
As we have analysed the different parameters of banking sector for FY21, readers would be interested in knowing what to expect from Indian banks in FY22 as whole. There are few of the positives that emerge at the horizon. The first and the foremost factor is the asset quality is unlikely to deteriorate further, especially the PSU Banks. Just to put in simple words, while in mid of FY21 the Asset quality pressure was considered as severe the asset quality of Indian Banks’ has been surprisingly remaining resilient.
Second factor is the growth in lending is likely to be better starting from Q2FY22. In our previous blog we had mentioned about lowest credit growth since FY11. We feel the lending Growth would start soon as the interest rates are still lower and capex would begin soon. Another factor is the capital and liquidity scenario has been good and hence would work as a downside risk cushion from NIM. Regulatory support has been visible the past one year and even the Government is positively providing support. All these factors provide a good picture for FY22. Naturally there are few If’s and But’s. Any impact of the Third Wave of Covid-19 would make an adverse impact on the growth parameters. Even the RBI Policy would play an important part. RBI would have to manage a difficult balance between growth and inflation.
As we have spoken about what to expect from the Banking sector in FY22, let’s have a look at top 5 banks based on the market capitalisation basis From Public as well private banks segment.
The following chart shows the top five PSU banks on the basis of market capitalisation as on July 16, 2021. As expected the top of the list is the largest PSU Bank SBI. Indian Overseas Bank is the Second with a significant difference in the market Cap of both the banks. This shows a wide gap between how a leader has been performing and the others have been comparatively laggards. We are also providing a chart of PAT posted by Banks in FY21.
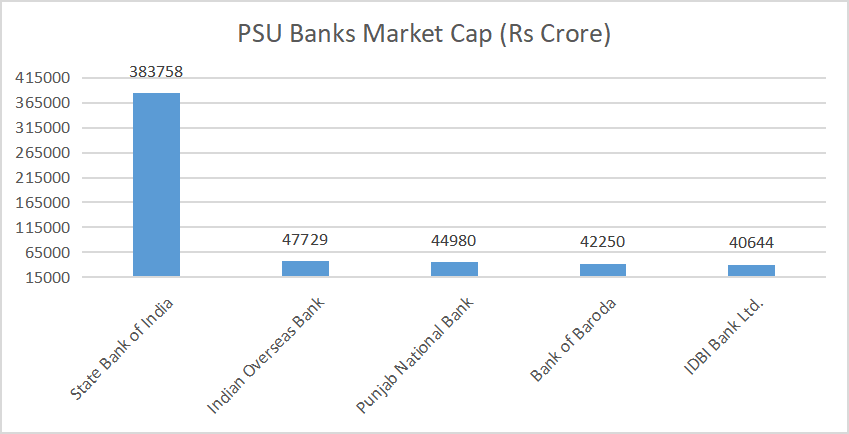
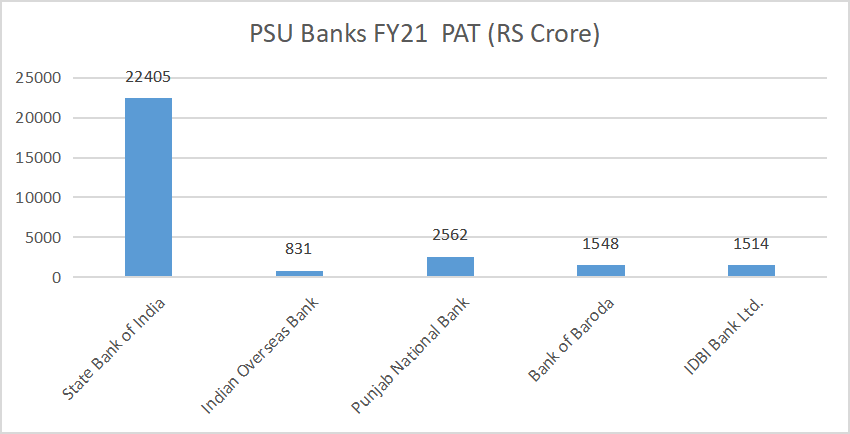
As we mentioned earlier SBI tops the chart in PSU banks based on the market Capitalisation basis and even on PAT basis. The market cap is Rs 3,83,753 crore. As regards the stock performance the 52 week stands at Rs 441.95 made of June3, 2021 the 52 week Low has been Rs 175.50 as on June 24, 2020.

Indian Overseas Bank has managed to stand at second position with a market cap of Rs 47,729 crore. As for the 52 week high, it was Rs 29 as on June 30, 2021. The 52 week low was Rs 8.5 as on October 16, 2020.

PNB despite all the noise against it stands at third positon with a market cap of Rs 44,980 crore. The 52 week high for the scrip was 46.35 posted on February 19, 2021. The 52 week low was 26.30 made as on October 29, 2020.

Bank of Baroda stands at fourth position with a market Cap of Rs 42,250 crore. As for the scrip movement on the bourses – 52 week High of Rs 99.85 was made on February 19, 2021 and 52 week low was Rs 39.5 as on September 25, 2020.

Despite being poor performer on all the parameters IDBI Banks stands at fifth position with a market Cap of Rs 40,644 crore. The 52 week high for the counter was Rs 45.2 made on August 24, 2020 and the 52 week low of Rs 26.35 was made on January 25, 2021.

Let’s first take a look at the chart providing details about top five private banks on the market capitalisation basis.
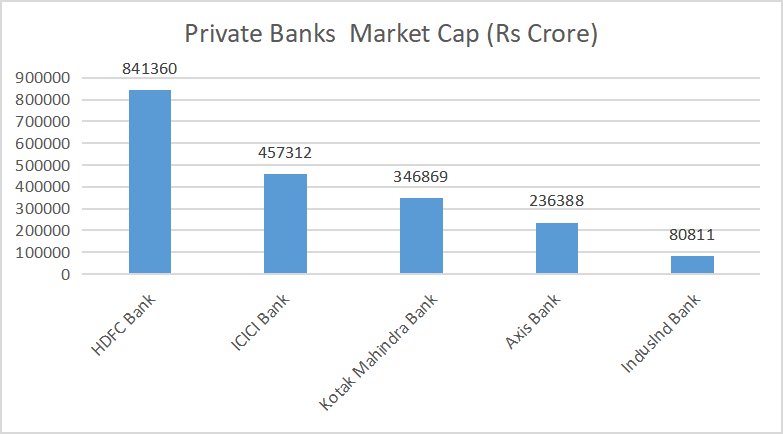
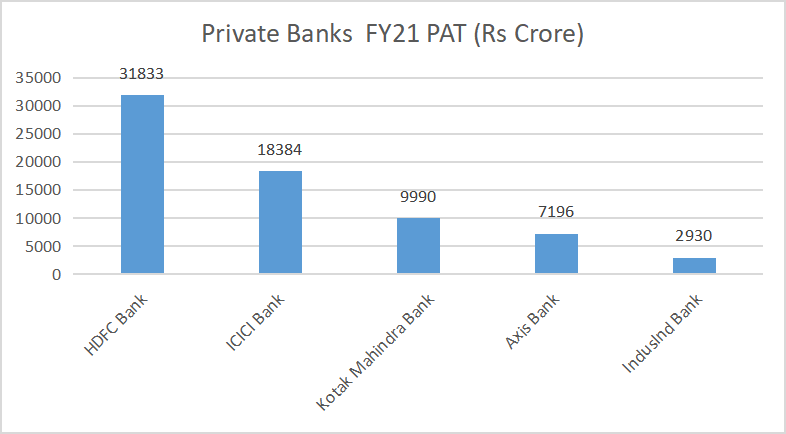
As lot has been written on the private Sector banks and hence we are only providing market Cap numbers and 52 week high and low data for top five private banks.
Market Cap – Rs 8,41, 360 Crore 52 week High – Rs 1641 ( February 16, 2021) 52 Week Low Rs 993 (August 3, 2020)

Market Cap – Rs 4,57,312 Crore 52 week High – Rs 679 ( February 16, 2021) 52 Week Low Rs 334 (Sept 24, 2020)

Market Cap – Rs 3,46,869 Crore 52 week High – Rs 2049 ( February 16, 2021) 52 Week Low Rs 1231 (Sept 25, 2020)

Market Cap – Rs 2,36,388 Crore 52 week High – Rs 799 ( February 15, 2021) 52 Week Low Rs 400 (Sept 25, 2020)

Market Cap – Rs 80,811 Crore, 52 week High – Rs 1119 (February 25, 2021) 52 Week Low Rs 483 (August 4, 2020)

All in all The Indian banking industry is poised to witness a healthy rise in credit demand from the retail and MSME verticals. Even the new schemes from the Government would Result in a rise in credit offtake. Borrower’s performance is stabilising, secured credit would be the mainstay and margins are likely to remain healthy. Does that mean banking is looking to be a very safe sector? Maybe not. Reason being the valuations in few of the private Banks are already seems to fully pricing the positive factors. PSU Banks however are yet to fully price in the positives and hence can be looked at with a perspective of next 18 to 24 months. But in private banks – it is better to opt for a stock specific approach based on valuations.
Published on: Aug 31, 2021, 1:11 AM IST
We're Live on WhatsApp! Join our channel for market insights & updates